How to measure the dollar value and ROI of cyber security
With the rise of cyber attacks and the myriad of cyber products on the market, it can be difficult to know which cyber security initiatives to focus on to get the best value in terms of spend and effectiveness.Key Takeaways
- While many organisations see cyber security as a cost centre, it should be framed as an investment in protecting business-critical assets.
- Framing cyber security in terms of avoided costs, improved confidence and reduced regulatory intervention makes its ROI more tangible for executives and boards.
- Using structured models like risk scenarios mapped to controls helps organisations translate security outcomes into dollar values and justify spending decisions.
Calculating the cyber risk
Cyber risk is just one of many risks for organisations to be across, and cyber security is just another hungry mouth to feed when it comes to budget time.
Cyber security appears to be expensive, breaches appear to be inevitable, and it is difficult to know whether the money spend in cyber would provide a good return on investment or, to what extent would reduce the fall-out of a significant cyber-attack.
Indicative potential financial losses can be estimated using the annual IBM/Ponemon Cost of a Data Breach Report, based on the number of records, industry, and country. The report also provides good data around cost mitigating and cost amplifying factors. However, there is an endless number of cyber security tools, services, and standards on the market, and it is difficult to decide what to pick for the best financial value and ROI.
The Essential Eight Maturity Model, ISO 27001 Annex A controls and NIST Cybersecurity Framework (CSF) all provide best practice guidance on cyber security processes, tools and people. However, the question remains on how to calculate their financial value vs their costs and ROI.
It's better to prevent a cyber-attack in the first place. The stronger the protective controls, the less likely a threat will eventuate on the most valuable tangible and intangible assets.
One way of being able to do this is below.
The first step is to estimate the financial value of the most important data in the organisation whilst also seeing this data as a type of intangible asset. The questions below will help determine these figures:
- Intellectual property and goodwill are already well-known intangible assets. What could be the cost of a loss of competitive advantage and brand equity if data supporting these were lost?
- For data used for strategic decisions, data on new markets or data on customers – this type of data directly contributes towards successfully generating future growth for the organisation. What is the projected financial growth that this data contributes towards, or on the flipside, what could be the potential loss of growth if that data was corrupted or stolen?
- For data relating to new offerings – what could be the impact on speed to market and estimated future earnings due to this data being temporarily or permanently corrupted or stolen?
- For data that provides information on management accounting, forecasting and cash flow management – what could be the potential loss of revenue recognition and cash flow issues by that data being missing or scrambled?
The above examples focus on financial losses. The following are examples on how to estimate value creation due to implementing “best practice” cyber security.
- Being transparent to customers about cyber risks enhances long-term value
- Top-line growth by customers having more confidence in the organisation’s ability to protect their data
- Cost reductions by having more effective cyber security tools, processes and people
- Less regulatory and legal interventions, by being able to reduce both the likelihood of a major cyber incident and the potential fall-out
The next step is to describe 2-3 top-down cyber risks. Top-down risks are a useful way for the Board to be kept informed on a regular basis on cyber security without all the operational detail
As a cyber risk consultant, my preference is to describe top down risks in a way which is similar to the FAIR ™ model. The description includes the assets, threat, data, and the resulting potential primary and secondary impacts.
These components are then mapped against the associated NIST “protect, detect, respond and recover” controls.
The final step is to then estimate $ values against each of the components. The table below shows how this is done.
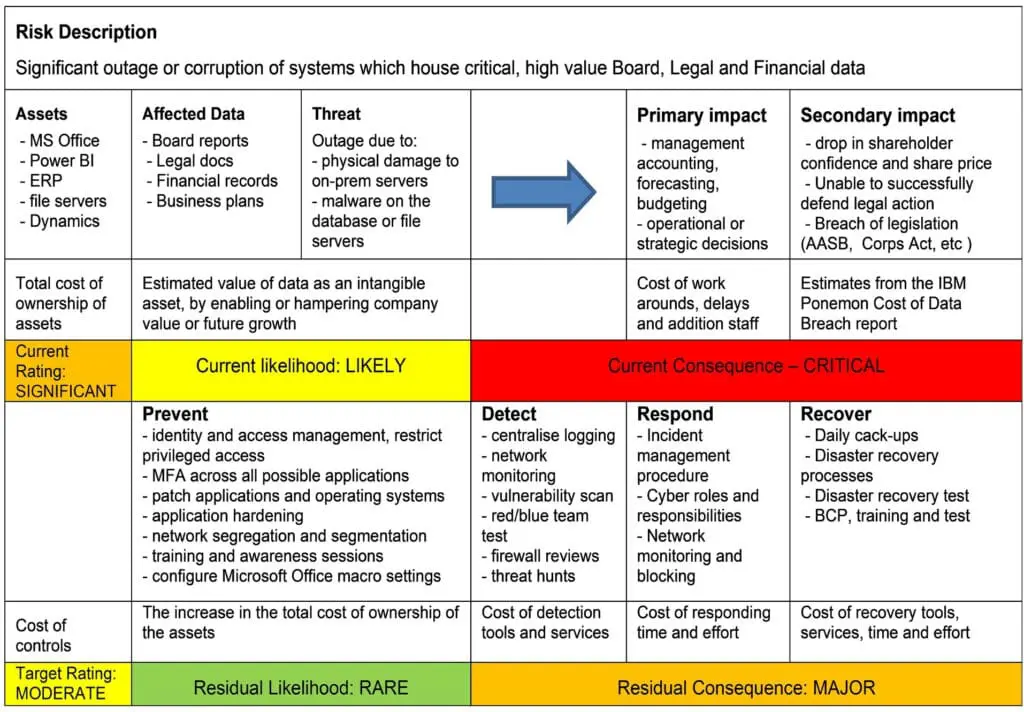
The most expensive cost is the loss due to the secondary impact, which can be estimated from the IBM Ponemon Cost of Data Breach report (average of USD 3.86 million in 2021). The cheapest costs are those relating to respond and recover controls.
There is a direct correlation between the effectiveness of detective controls and the ability to reduce both the likelihood and impact of primary and secondary impacts. Ineffective detective controls also correlate with the cost of respond and recovery controls, which could increase exponentially during a major cyber-attack.
The effectiveness of detective controls increases by performing red/blue team tests, firewall reviews and tuning the SIEM to respond to known attack techniques, such as those in the MITRE ATT&CK framework.
It’s better to prevent a cyber-attack in the first place. The stronger the protective controls, the less likely a threat will eventuate on the most valuable tangible and intangible assets.
NIST recommends all types of controls (identify, protect, detect, respond, and recover) to be equally mature in order to stand the best chance of preventing and responding to a cyber-attack. However, it is not possible to do everything at once, given the time, cost, and resource constraints.
In conclusion, the above table helps to identify which of the controls will be most suitable to help mitigate and manage the top cyber risks. The costs can then be calculated based on the current controls and additional mitigations and show how these controls will either protect the value of the data or minimise the fall-out of both primary and secondary impacts.
This is how it is possible to calculate both the financial value and ROI of cyber security.
The piece was written by cyber risk and compliance specialist Veronica Hall.